Spreadsheets to climate software: the MVP tech stack shift
When does a climate MVP spreadsheet stop being a useful model and start becoming a product risk?
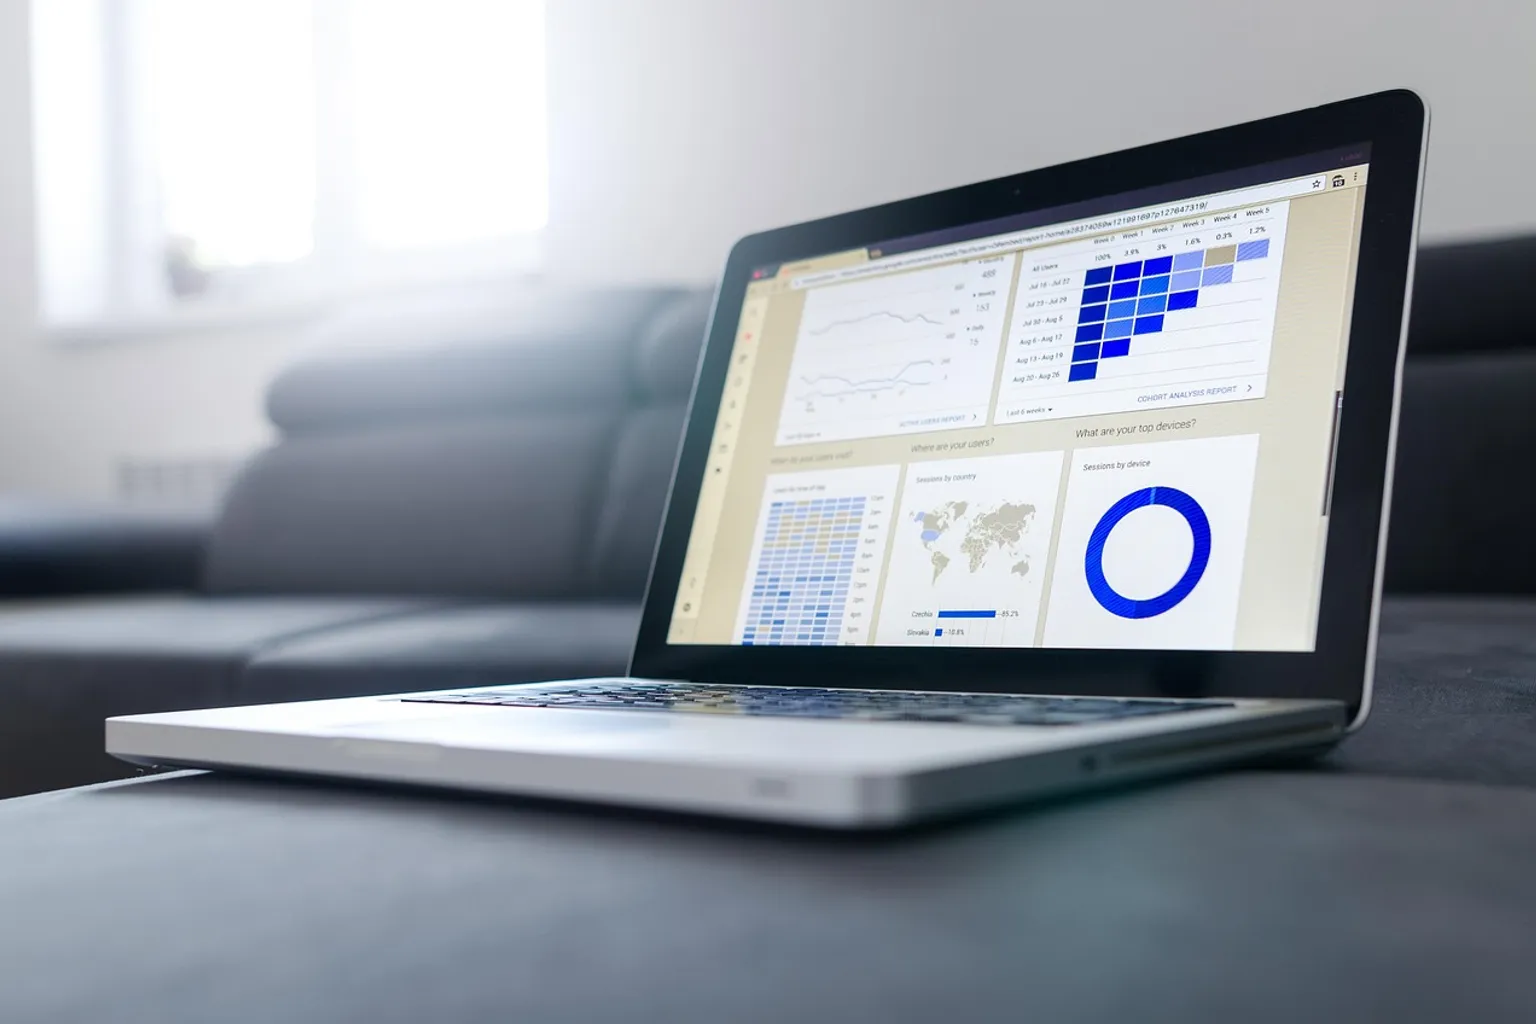
Usually, it is not when the file becomes large. It is when several people need to use it at once, the underlying emissions data changes, a customer asks how a number was calculated, or an investor wants to see a repeatable process rather than a carefully maintained workbook. At that point, the problem is no longer the spreadsheet itself. The problem is that your company has outgrown a tool designed for one person, one moment, and one version of the truth.
For a non-technical climate founder, the move from a climate MVP spreadsheet to a software stack can feel like a decision between two extremes: keep patching the workbook or spend heavily on custom infrastructure. There is a more practical middle path. We can preserve the speed and transparency of spreadsheets while gradually introducing structured databases, no-code interfaces, APIs, and audit-ready workflows.
That transition is not a dramatic rebuild. It is a product development decision about what needs to become reliable first.
The spreadsheet ceiling: when manual LCA modeling becomes a liability
Spreadsheets are often exactly the right starting point for a climate company.
At pre-seed, we are still testing assumptions. We may be estimating a product’s life-cycle emissions, comparing activity data from a handful of customers, or building a first carbon-impact model for an investor conversation. A spreadsheet makes those assumptions visible. You can change an emissions factor, adjust a boundary condition, or test a scenario without waiting for a developer.
That flexibility matters. Early climate companies rarely know their final data model at the beginning. A spreadsheet gives you room to discover it.
The ceiling appears when the workbook becomes responsible for operations rather than learning. Watch for these signals:
- The same data is entered more than once. A customer’s activity data appears in an intake sheet, a calculation tab, a reporting file, and perhaps a separate investor model.
- Formulas have become tribal knowledge. One person knows which cells should never be edited and which hidden tab contains the “real” factor.
- Emission factors are copied manually. A factor is selected from a static reference file, but there is no clear record of its source, version, geography, or effective date.
- Scenario analysis and reported results are mixed together. A number intended for internal planning is easily mistaken for a verified customer output.
- The file is too important to open casually. People duplicate it for safety, creating multiple versions with different assumptions.
- A customer or auditor asks for a trail. You can explain the result, but reconstructing the exact input, factor, formula, and approval history takes days.
These are not signs that spreadsheets are “bad.” They are signs that your operating model now includes coordination, permissions, repeatability, and change management.
A spreadsheet can calculate a footprint. It is much less comfortable as the system that governs who submitted the data, which methodology was used, when an emissions factor changed, and whether a result was reviewed before publication.
The first job of climate software is not to make the spreadsheet disappear. It is to make the important parts of the spreadsheet dependable.
Separate the model from the workflow
A useful first distinction is between your calculation model and your operating workflow.
The calculation model answers questions such as:
- Which activity data produces which emissions category?
- What unit conversion is required?
- Which emissions factor applies?
- How are results aggregated across a product, facility, or reporting period?
- Which assumptions affect the final impact claim?
The workflow answers different questions:
- Who submits the data?
- What happens when a field is incomplete?
- Who reviews an unusual value?
- Which version of the methodology is active?
- How is a correction recorded?
- What can a customer see, edit, approve, or export?
Your first software investment should usually target the workflow around the model. If the methodology is still evolving, hard-coding every calculation can slow learning. But if your team is losing track of submissions, versions, and approvals, even a simple workflow layer can remove a great deal of operational friction.
A simple test for readiness
Take one real customer or internal reporting cycle and trace it from raw input to final output. Do not review the workbook cell by cell. Follow the information:
1. Where does the data originate?
2. Who enters or uploads it?
3. What format does it arrive in?
4. Which assumptions are added manually?
5. Where are emission factors selected?
6. Which calculations happen automatically?
7. Who reviews the result?
8. What evidence would you show if the customer questioned it six months later?
If the answers depend on a particular person remembering a particular process, you have found the first boundary for your climate MVP spreadsheet to software stack transition.
Architecting the hybrid stack: keep speed, add structure
The most resilient early climatetech software stack is often hybrid. It uses the tools you already understand, but assigns each tool a clearer job.
A practical early architecture might include:
| Layer | Early-stage choice | What it should handle |
|---|---|---|
| Data intake | Form, spreadsheet upload, or lightweight portal | Collect activity data with units, dates, source notes, and ownership |
| Working database | Airtable, a managed database, or structured tables | Store records in consistent fields rather than scattered cells |
| User interface | Glide, Softr, Bubble, or a simple custom front end | Give customers and team members a controlled way to view or submit data |
| Calculation layer | No-code automations, formulas, or lean code | Apply conversions, emission factors, validation rules, and aggregation |
| Emissions data | Curated database or API-first provider | Retrieve factors with metadata and consistent identifiers |
| Reporting | Generated reports, dashboards, or exports | Present results with assumptions, methodology, and review status |
| Audit trail | Versioned records and activity logs | Show what changed, when it changed, and who approved it |
This does not mean every startup needs all seven layers on day one. It means we should be explicit about where each responsibility lives.
For example, a spreadsheet may remain the best place for a scientist to test a new methodology. It should not necessarily remain the only place where a customer enters production data. Similarly, a no-code interface may be perfectly adequate for a first reporting portal, while the underlying emissions-factor service should be more durable from the beginning.
Use a system of record, not a system of everything
The phrase “single source of truth” is often used too casually. In practice, you may have several legitimate sources:
- the customer’s original submission,
- the normalized record used for calculation,
- the emissions-factor record,
- the calculation output,
- the approved report.
The goal is not to force all of these into one table. The goal is to define their relationships.
At minimum, each activity record should have a stable identifier and fields for:
- reporting period,
- activity type,
- quantity,
- unit,
- geography,
- data source,
- collection date,
- quality or confidence status,
- emissions-factor identifier,
- methodology version,
- reviewer or approval status.
If you cannot explain how a final result connects back to those fields, the software may look polished while remaining difficult to trust.
Where no-code works well
No-code climate MVP development is particularly useful when you are validating:
- whether customers will submit the required data,
- which workflow steps cause confusion,
- which outputs customers actually use,
- whether a reporting format changes a purchasing or operational decision,
- how much manual review is required per account.
Tools such as Bubble, Glide, and Softr can help you build functional interfaces without committing to a full engineering team. Glide, for example, can create an app experience from structured spreadsheet data, which makes it useful when the team already has a working operational model.
A basic no-code or lean-code MVP commonly falls in the range of $5,000 to $10,000 and may take 8 to 12 weeks, depending on the data complexity, integrations, and quality of the user experience. That is enough time to build something customers can use and enough investment to test demand before designing long-term infrastructure.
But no-code is not a promise that infrastructure decisions disappear. The more customers you add, the more carefully you will need to manage permissions, data validation, calculation performance, backups, and integration limits.
Where no-code starts to strain
You may be approaching the limits of a no-code backend when:
- a single calculation requires many chained automations,
- customers need different methodologies or account-specific rules,
- the volume of activity records makes updates slow,
- you need complex permissions across customers, suppliers, and auditors,
- data must synchronize with enterprise systems,
- the workflow requires robust retry logic and error handling,
- an external auditor needs a highly controlled history of changes.
At that stage, the right move is not necessarily to throw away the MVP. A well-designed no-code product can teach you which parts deserve custom development. The transition becomes much easier if your records already have stable identifiers, clear ownership, and explicit calculation steps.
Automating emission factors: the data layer behind trustworthy results
For many climate products, the emissions-factor layer is where a spreadsheet begins to become fragile.
A manual model may contain a reference tab with hundreds or thousands of factors. Someone searches by keyword, selects a value, copies it into a calculation sheet, and adds a note. That can work for initial life-cycle assessment modeling. It becomes difficult when the product must handle multiple geographies, units, methodologies, or reporting periods.
An API-first climate database changes the interaction. Instead of searching and copying a factor manually, the application can request a factor based on defined inputs such as:
- activity category,
- unit,
- geography,
- gas or impact metric,
- data quality requirements,
- calculation date,
- methodology or source.
Platforms such as Climatiq provide programmatic access to a database containing more than one million emission factors, with more than 944,000 available through a REST API, according to the research material for this article. The value is not only scale. It is the ability to make the selection process repeatable and record the factor used alongside the calculation.
That last part is essential. An API call alone does not create a defensible result. Your product should store enough information to reconstruct what happened:
1. The original activity value and unit.
2. Any conversion applied before calculation.
3. The factor identifier and source.
4. The factor’s geography and scope.
5. The methodology or calculation mode.
6. The date the factor was retrieved.
7. The resulting emissions value.
8. Any user override or manual adjustment.
9. The person or system that approved the result.
Design for uncertainty instead of hiding it
Climate data is rarely as clean as a software demo suggests. Customers may provide invoices, estimates, supplier averages, production counts, or incomplete utility records. A useful product does not pretend that all inputs have equal quality.
Add a confidence or data-quality status to the workflow. It might distinguish between:
- measured primary data,
- supplier-specific data,
- industry-average data,
- modeled estimates,
- missing or provisional data.
This supports better conversations with customers and investors. It also helps your team prioritize product improvements. If half of the result depends on a recurring estimate, the next feature may not be a more beautiful dashboard. It may be an integration that captures primary data at the source.
Avoid turning automation into false precision
A calculation that runs instantly can still be based on a weak assumption. Automation improves consistency and speed; it does not automatically validate the underlying methodology.
That is especially important when your product makes claims about avoided emissions, removals, product footprints, or financial impact. Build space for review, explanation, and correction. A customer should be able to see why a result changed, not simply receive a different number after an invisible backend update.
The two-week migration: moving from static sheets to working software
A spreadsheet-to-software migration does not need to begin with a six-month platform project. For many early-stage companies, a focused onboarding process can take as little as two weeks when the scope is limited to validating existing data and connecting it to automated workflows.
The timeline depends on how consistent the spreadsheet is. A clean workbook with stable columns is a different project from a folder of customized customer files, each with its own formulas and naming conventions.
Here is a practical sequence.
1. Freeze the current model
Before moving anything, make a dated copy of the workbook and designate it as the reference version. Do not keep editing the “old” file while simultaneously importing data into the new system.
Document the current calculation path, including manual steps. The awkward workaround you are tempted to remove may be carrying an important business rule.
2. Inventory the fields
Create a field map that translates spreadsheet columns into structured records. For every field, decide:
- Is it an input, a derived value, or a note?
- Is it required?
- What is its unit?
- Who owns it?
- Can it change after submission?
- Does it need a validation rule?
- Should its history be preserved?
This is where raw science becomes product architecture. A field such as “energy use” is not enough. You may need energy type, quantity, unit, period, location, supplier, and evidence source.
3. Clean before importing
Do not automate inconsistent data at full speed. Normalize units, dates, category names, and customer identifiers first.
Typical spreadsheet problems include:
- kilograms and tonnes used in the same column,
- month names mixed with exact dates,
- blank cells representing both zero and unknown,
- customer names spelled differently across tabs,
- formulas replaced by hard-coded values,
- factor names that cannot be matched to a source.
A small amount of cleanup now will prevent a large amount of debugging later.
4. Reconcile the numbers
Run the same sample through the spreadsheet and the new workflow. Compare the outputs line by line.
If the numbers differ, do not assume the software is wrong. The difference may come from a unit conversion, rounding convention, factor version, boundary definition, or a hidden spreadsheet formula.
Keep a reconciliation log. Each resolved difference becomes part of your product knowledge and testing library.
5. Add human approval
The first automated workflow should not send every result directly to a customer. Add a review state such as:
- draft,
- needs information,
- calculated,
- under review,
- approved,
- superseded.
This creates a safe bridge between manual operations and automation. It also gives you a way to measure where the workflow still needs human judgment.
6. Migrate one use case first
Choose a narrow, repeated workflow rather than trying to digitize the entire company. For example:
- monthly electricity data for one customer segment,
- product-footprint estimates for one category,
- supplier questionnaires for one material,
- internal emissions reporting for one facility type.
A focused migration reveals the real edge cases without burying the team in an infrastructure project.
A two-week operating plan
| Period | Focus | Deliverable |
|---|---|---|
| Days 1–2 | Freeze and map the existing model | Reference workbook, field inventory, process notes |
| Days 3–5 | Clean and structure the data | Normalized records and defined identifiers |
| Days 6–8 | Configure the workflow | Intake, validation, calculation, and status fields |
| Days 9–10 | Connect factors or integrations | Repeatable factor retrieval and source metadata |
| Days 11–12 | Reconcile sample cases | Documented matches and explained discrepancies |
| Days 13–14 | Pilot with users | Reviewed output, feedback, and next-build priorities |
The purpose of this sprint is not to create a final platform. It is to establish a reliable path from input to output and learn which parts should be automated next.
Navigating compliance: designing for evidence, not just reporting
Regulation is one reason climate software is moving from occasional spreadsheet exercises toward continuous data workflows.
Frameworks such as the EU’s CSRD and the UK’s SECR increase the pressure on companies to produce consistent, traceable emissions information. A spreadsheet may still play a role in collecting and reviewing data, but a growing reporting obligation requires more than a final number at the end of the process.
You need to know:
- where the information came from,
- which period it covers,
- which methodology was used,
- what changed from the previous period,
- which estimates were applied,
- who reviewed the result,
- what supporting evidence exists.
This is the difference between a calculation and an operational record.
Build a reporting data model before building a compliance dashboard
A compliance dashboard is not the foundation. The foundation is a data model that preserves context.
For each reported value, aim to retain:
- source document or submission reference,
- reporting boundary,
- organizational or product scope,
- activity period,
- calculation methodology,
- emissions factor metadata,
- data-quality classification,
- revision history,
- approval status.
If these elements are missing, a polished dashboard may simply make an unsupported result easier to distribute.
The same principle applies to carbon-market data. Regulatory and market mechanisms can change while your static workbook remains unchanged. The research material points to the June 30, 2026 transition deadline for Clean Development Mechanism projects moving toward the UN’s Article 6.4 mechanism; by that point, 415 projects had secured host-government approval to transition. Whether your startup works directly with credits or builds adjacent infrastructure, the operational lesson is the same: a static reference sheet cannot reliably represent a market where eligibility, deadlines, and project status evolve.
Your software needs a way to mark data as current, deprecated, provisional, or subject to a rule change. That may begin as a simple status field and a review queue. It does not need to be a complex compliance engine on the first day.
What software can and cannot promise
Automating carbon accounting can reduce repetitive work and make errors easier to detect. It cannot, by itself, guarantee regulatory compliance or replace third-party assurance.
Your product may correctly calculate a result from the data it received while the data itself is incomplete. Or it may apply a valid factor to a boundary that the customer defined incorrectly. Keep the distinction clear in both the product and the sales conversation.
A trustworthy climate startup makes uncertainty visible. That is not a weakness in the MVP. It is part of the product’s credibility.
The non-technical founder’s product development lifecycle
For a non-technical climate founder, the most useful technology plan is not a list of tools. It is a sequence of decisions.
Start with the decision your customer needs to make
Do not begin with “we need an emissions platform.” Begin with the customer’s operational decision:
- Should we switch suppliers?
- Which facility has the largest reduction opportunity?
- Can we substantiate a product claim?
- Which data must we collect before a reporting deadline?
- Does a proposed intervention create enough impact to justify its cost?
The workflow, calculations, and interface should support that decision. Otherwise, you risk building a data collection product that produces impressive totals but does not change behavior.
Choose the smallest repeatable workflow
A good MVP is not the smallest feature set in the abstract. It is the smallest workflow that can be repeated with multiple users and still produce a useful result.
That might include:
- one data intake path,
- one emissions boundary,
- one or two calculation methodologies,
- one review process,
- one clear output,
- one feedback loop.
If you can run that workflow ten times and see where it breaks, you have better evidence for your next technical investment than a large feature roadmap can provide.
Treat usability as part of climate impact
Climate products often ask users for unfamiliar data under time pressure. A confusing interface can quietly undermine adoption. Research cited in the brief indicates that 88% of users do not return to apps with poor usability.
That is not a reason to chase visual polish. It is a reason to remove avoidable friction:
- explain why each field is needed,
- show accepted units beside the input,
- allow users to save progress,
- flag suspicious values without shaming the user,
- distinguish “unknown” from zero,
- provide an example for difficult fields,
- make the next action obvious.
A customer who cannot complete the data request will not benefit from the sophistication of your emissions database.
Decide what to build, buy, and postpone
A simple decision table can keep your stack aligned with the stage of the company:
| Need | Build now | Buy or integrate | Postpone |
|---|---|---|---|
| Customer data intake | Narrow workflow and validation rules | Form or portal tooling | Fully configurable enterprise intake |
| Emissions factors | Mapping logic and metadata storage | Established factor API or database | Building a global factor library from scratch |
| Calculations | Core methodology for one use case | Specialized calculation services where appropriate | Supporting every framework and sector |
| Reporting | One useful customer output | Export and document tools | Multi-tenant reporting suite |
| Auditability | Statuses, identifiers, revision history | Managed storage and access controls | Extensive custom compliance automation |
| Collaboration | Clear ownership and review steps | Standard project tools | Complex organizational permissions |
This is the point where alignment matters more than ambition. We want enough technology to make the workflow reliable, not so much that every customer experiment becomes expensive to change.
Making the transition without losing the science
The strongest climate MVPs treat technology as a translation layer between scientific reasoning and everyday operations.
Your scientific model may include boundaries, baselines, uncertainty ranges, emission factors, conversion rules, and methodological choices. Your customer may experience it as a form, a data request, a result, and a recommendation. Both views need to remain connected.
That means documenting the decisions that are easy to lose during a software build:
- Why was this boundary chosen?
- Which activities are excluded?
- What does the factor represent?
- Which assumptions are customer-specific?
- What happens when data is missing?
- Can a result be compared across periods?
- What would invalidate the comparison?
When these questions are visible in the product, you do not have to choose between scientific rigor and a friendly user experience. You can give users a simpler path while preserving the detail needed for review.
The transition from a climate MVP spreadsheet to a software stack is successful when the company gains three things at once:
1. Speed, because repeated work is automated.
2. Clarity, because inputs, assumptions, and outputs are connected.
3. Trust, because the result can be explained and revisited.
Start with one recurring workflow. Freeze the spreadsheet that currently defines it. Map the fields, normalize the units, connect a reliable factor source, and run a two-week pilot with a human approval step. That is enough to move from “we have a model” to “we have the beginnings of an operating product.”
You do not need to build the final platform before you learn what the business requires. You need a small, traceable system that helps you learn faster without losing the science along the way.